Now that the Thanksgiving and Black Friday are left behind, we're all back at our desks, some of us having PHPStorm open for the whole day. In this post, I'll say a few words on this
beautiful IDE,
PHPUnit and
XDebug.
You know that unit tests are essential, don't you? So do the PHPStorm developers. This industry-standard level IDE has tons of capabilities for integrating test frameworks and debuggers into your project. Even if you use VMs or containers to run your development environment, chances are they got you covered!
I often see even experienced PHP programmers debugging their code with
var_dump(), which is obviously not the best way to do it. If you see the code for the first time, if you work with legacy code - step-by-step interactive debugging is the way to go. Sometimes it can save you hours of old school var_dumping.
As of unit tests, I often hear that it's good enough to run tests from the terminal. I even know a guy who runs
watch phpunit /path/to/test while developing: this way the test is run every 2 seconds, you switch to the terminal whenever you want to see the latest results and that's it. However, there are certain advantages in running tests from the IDE. First, it's super-handy to launch a test method, test class or a whole folder with tests, just by pressing a hotkey. Second, the test results appear right there, in PHPStorm, with failures and their stack traces, every entry clickable and takes you directly to the file:line where a nasty thing happened. I also find the ability to run a debugger for a unit test, extremely attractive. Test fails, you click on a trace entry, get to a problematic line, place a break point, re-run the test in debug mode - and there you go.
For all those integrations, you will first need to setup the PHP interpreter for the project:
Configuring PHP Development Environment. You will find both local and remote interpreter setups. "Local" is the PHP that you have on your workstation, the host machine. "Remote" can be pretty much everything: SSH if your Dev environment runs on a shared sandbox for all developers, docker or docker-compose if you run it using docker containers.
Next step - creating PHPUnit configuration. Go to
Settings -> Languages and Frameworks -> PHP -> Test Frameworks. Follow
this guide, it has much more information which will be more up-to-date than this post.
Don't forget to set Path Mappings for your remote environments! That is, you probably have your project in, say,
$HOME/projects/cool-project, but inside a docker or on a remote host it might be located at
/app or
/var/www, then you have to let PHPStorm know about this.
Once you're done with PHPUnit setup, you can finally
run your tests! The default shortcut on my Linux machine is
Ctrl+Shift+F10 (shortcuts are usually different on Mac though). Place a cursor inside a test method, press the shotcut: PHPStorm will launch PHPUnit with
that particular test method! When the cursor in a scope of test class but not inside a test method - the whole test class will be run. And, you also can select a whole folder with tests, in the project tree and run it, ain't that cool?
A small tip for the docker-compose lovers. When I first set PHPStorm integration with docker-compose and ran the tests, I was quite surprised (unpleasantly) to see that my
php-fpm service that I was connecting to, is gone after the test process is finished. Took me some time to figure out that it's PHPStorm's expected behavior. It stops the target service after it's done testing. A workaround I started to use is as follows: I just add another service called
phpunit which uses a php-fpm or php-cli image, and is not needed by anything except unit testing in PHPStorm.
Now to debugging.
Debugging is like being the detective in a crime movie where you are also the murderer. Filipe Fortes a.k.a. @fortes
Obviously, your PHP interpreter in development environment will need a debugger extension in order for you to debug interactively. PHPStorm support the two most widely used options:
XDebug and
Zend Debugger. When using docker I usually make a separate Dockerfile for development, using production image as base, then add development tools,
XDebug being the most important. Honestly, I've never used
Zend Debugger, so have little to tell about its' nuances.
Got an extension? Go to
Debugging Ultimate Guide! Debugger settings in PHPStorm are at
Settings -> Languages and Frameworks -> PHP -> Debug. Most of the time you don't need to change them.
Again, a note for docker-compose users. There is an XDebug setting that allow debugger to resolve the client (PHPStorm) IP address:
xdebug.remoteconnect_back_. That's a disappointment but those will not work, at least with a default docker-compose setup. Thing is, all containers in a compose stack are running behind a network proxy provided by docker-compose. That is, the REMOTE_ADDR for all the containers will always be the IP of proxy. A workaround:
* disable
xdebug.remoteconnect_back_;
* add
.user.ini to the application root folder with the following contents:
xdebug.remotehost = 192.168.X.X_ (your machine's IP address in the LAN). It's generally a good idea to exclude
.user.ini from VCS control.
As a conclusion: if you still use
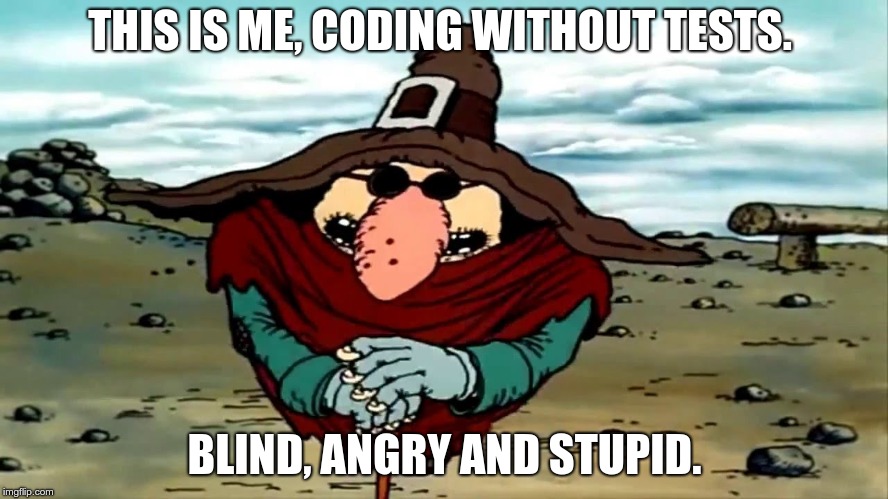
vardump()_ to debug, stop living in the stone age, upgrade your knowledge and become more productive! If you don't write unit tests, start doing it. If your managers say it's a waste of time, tell them that it's coding without tests that is a waste of time. And, if you find this post of any use, or have an opinion, or a question - please do comment!





 g10dra
 harikrishnanr
 christiemarie
 dmamontov
 MindNovae
 HowTos
